
Module 2b —
Report Writing
| Course Guide | Module 1 | Module 2a | Module 2b |
Tables
Given the nature of ILO reporting, the most likely need you will have for graphics is the presentation of statistics or figures in a table format. Tables are also the easiest visual to create with your standard word processing software.
Because tables can contain quite a lot of information in a short space, don’t let your readers figure the information out for themselves. Make reference to the table in the text just preceding it. Explain the general significance of the data in the table. Use your text to highlight significance: don't repeat the contents of the table verbatim in the text.
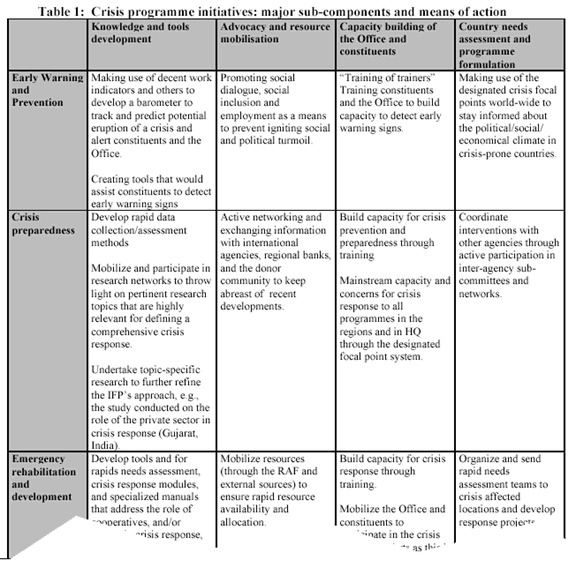
Tables are very useful for portraying exact or detailed values. However, they are also useful for creating associations between short descriptions of text. For example, the following table is used to show a range of initiatives under the same programme:
An independent evaluation of the InFocus Programme on Crisis Response and Reconstruction (Oct, 2003) page 7. |
